Machine Learning
Anomaly Detection
What are outliers/anomalies?
- anomaly: data object that deviates significantly from normal objects as if it were generated by a different mechanism
- e.g. unusual credit card purchase
- distinct from noise:
- noise is random error/variance in measured variable
- should be removed prior to anomaly detection
- are interesting as violations of mechanism generating normal data
- translate to significant/critical real life entities
- e.g. cyber intrusion, credit card fraud
- example of CCTV camera performing facial recognition
- anomaly: new face encountered
- noise: variation in lighting; person is wearing a mask
Variants of Anomaly detection problems
- given database $D$ find all data points $x\in D$ with anomaly scores greater than threshold $t$
- given database $D$ find $n$ data points $x\in D$ with highest anomaly scores
- given database $D$ of mostly normal, unlabelled data, and a test point $x$, compute its anomaly score with respect to $D$
- how well is some data point explained
Types of Anomalies
Global/Point anomaly
- object significantly deviates from rest of data set
- e.g. intrusion detection in computer networks
- issue: appropriate measure of deviation
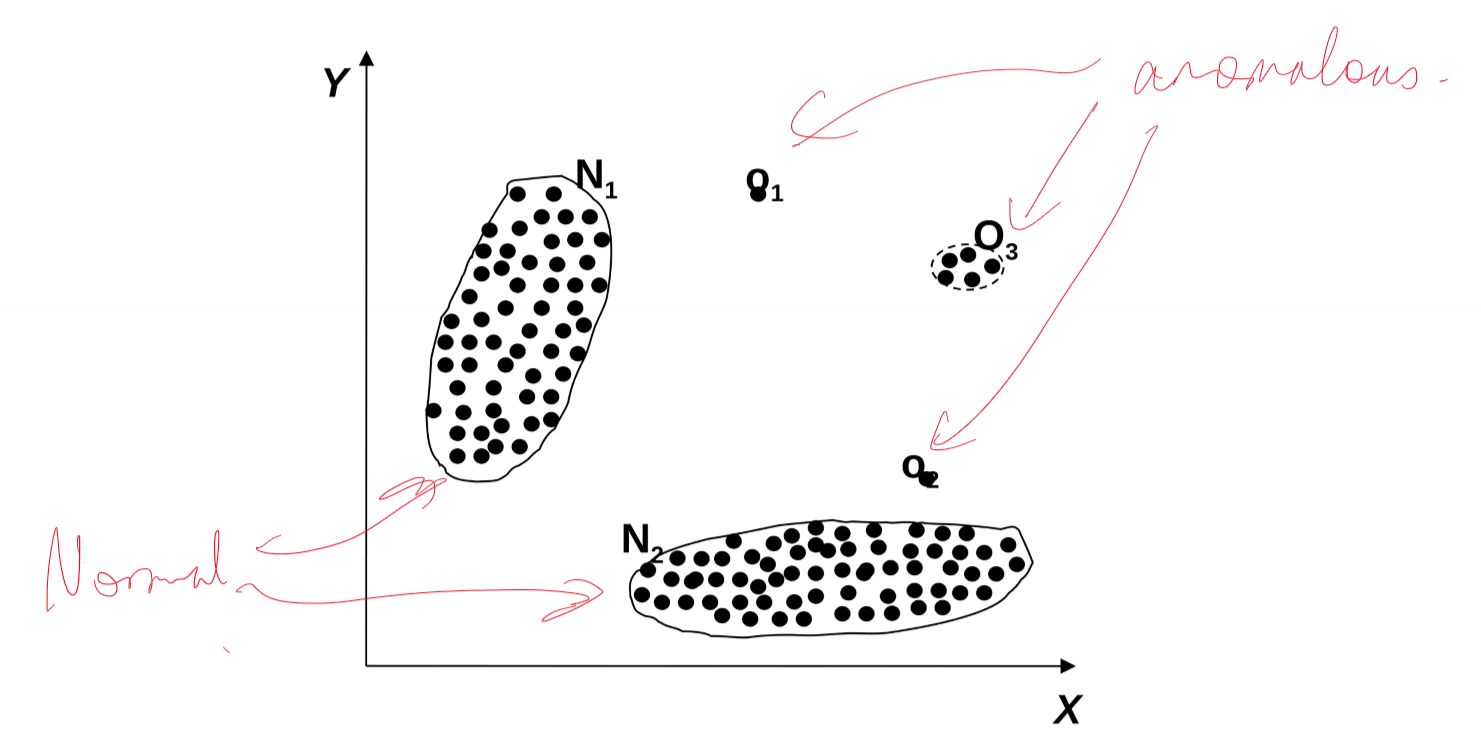
Contextual/Conditional Anomaly
- object deviates significantly based on selected context
- attributes need to be classified according to
- contextual attributes: define context e.g. time, location
- behavioural attributes: object characteristics used for anomaly evaluation, e.g. temperature
- generalisation of local anomalies whose density significantly deviates from local area
- issue: defining meaningful context
- example: 10°C in Paris: is this an anomaly?
- in June: yes
- in December: no
Collective Anomaly
- subset of objects collectively deviate significantly from the whole data set, even if individual data objects may not be anomalies
- e.g. intrusion detection
- mistype password once, producing a DoS packet: not anomalous
- collection of DOS packets all at once: anomalous
- detection
- consider behaviour of groups of objects
- requires background knowledge of relationship among data objects, e.g. distance or similarity measure
- requires a relationship among data instances, whether
- sequential data
- spatial data
- graph data
- individual instances are not anomalous by themselves
- e.g. ECG of normal heart rate with sudden flatline: you need background knowledge to know what normal ECG looks like
Anomaly Detection Paradigms
Supervised
- labels available for both normal data and anomalies: unrealistic to expect in reality
- samples that have been examined by domain expert are used for train and test
- e.g. medical domain and ECG
- challenge
- obtaining labels for both normal and anomalous data
- imbalanced classes: anomalies are rare
- could boost anomaly class and make up artificial anomalies
- cannot detect unknown/emerging anomalies
- catch as many outliers as possible, i.e. recall more important than accuracy. We don’t want to mislabel normal objects as outliers
Semi-Supervised
- labels only available for normal data, a more typical scenario
- model normal objects, then report those not matching the model as outliers
- challenges
- requires labels from normal class
- may get high false alarm rate from unseen legitimate records
Unsupervised Anomaly Detection
- no labels available
- assume normal objects are clustered into multiple groups having distinct features
- outlier is expected to be far away from any groups of normal objects
- steps
- build profile of normal behaviour through:
- summary statistics for overall population
- model of multivariate data distribution
- use normal profile to detect anomaly, as points varying significantly from normal profile
- build profile of normal behaviour through:
- challenges
- no guarantee normal objects will share strong patterns
- possible outliers may share high similarity in a small area
- e.g. in intrusion/virus detection, normal activities are diverse: unsupervised methods may have high FP rate and miss real outliers
- many clustering methods can be used for anomaly detection
- find clusters, then outliers are those points not belonging to any cluster
- problem 1: distinguishing noise from outliers
- problem 2: costly since first clustering; far less outliers than normal objects
Unsupervised Anomaly Detection Approaches
- statistical: assume normal data follow some statistical model
- proximity-based: object is an outlier if the nearest neighbours of the object are far away
- density-based: outliers are objects in regions of low density
- clustering-based: normal data belong to large, dense clusters
Statistical anomaly detection
- anomalies are objects fit poorly by a statistical model
- idea: learn a model fitting given data set
- identify objects in low probability regions as anomalous
- assumption: normal data is generated by parametric distribution with parameter $\theta$
- PDF of parametric distribution, $f(x,\theta)$, gives the probability that object $x$ is generated by the distribution
- the smaller the value, the more likely $x$ is an outlier
- challenges
- dependent on assumption of statistical model holding for the data
Pros
- theoretically well-founded
- statistical tests well understood, well validated
- quantitative measure of degree to which an object is an outlier
Cons
- data may be hard to model parametrically
- multiple modes
- varying density
- in high dimensions, data may be insufficient to estimate true distribution
Graphical Approaches
- boxplot (1D), scatter plot (2D), spin plot (3D)
- time consuming, subjective
Univariate data
- assuming univariate Gaussian distribution
- use maximum likelihood method to estimate $\mu, \sigma$
\(\hat\mu = \frac{1}{n}\sum_{i=1}^{n}x_i\) \(\hat\sigma^2 = \frac{1}{n}\sum_{i=1}^{n}(x_i-\hat\mu)^2\)
- choose confidence limits, e.g. $3\sigma$
- $\mu\pm3\sigma$ covers 99.7% of data
Multivariate data
- multivariate Gaussian distribution
- outliers defined by Mahalanobis distance
- apply Grubb’s test on the distances
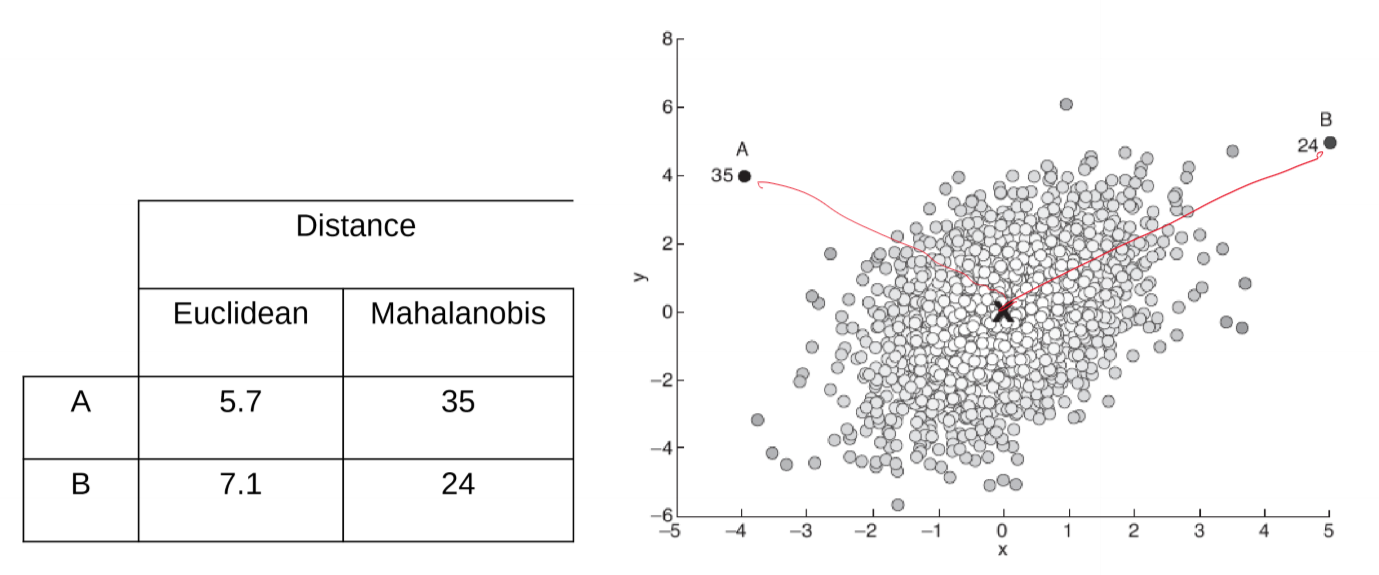
- in above image, Euclidean distance for B is greater than for A
- but there is much more variation on the $x$ axis, so we want to standardise such that each dimension has the same variation and range
- there is also correlation between x and y which needs to be controlled for
- Mahalanobis Distance
\(y^2 = (x-\bar x)' S^{-1} (x-\bar x)\)
- $S$: covariance matrix \(S = \frac{1}{n-1}\sum_{i=1}^{n}(x_i)-\bar x)(x_i-\bar x)'\)
Likelihood Approach
- assume dataset $D$ contains samples from a mixture of 2 probability distributions:
- $M$: majority distribution, estimated from data
- $A$: anomalous distribution, initially assumed to be uniform
- approach
- initially assume all data points belong to $M$ - estimate majority distribution
- let $L_t(D)$ be log-likelihood of $D$ at time $t$
- for each point $x_t\in M$ move it to $A$ - i.e. test whether it is an anomaly
- compute the difference $\Delta = L_t(D)-L_{t+1}(D)$
- if $\Delta > c$, some threshold value, then $x_t$ declared an anomaly and permanently moved to $A$
Proximity-based Anomaly Detection
- idea: anomalies are objects far from other objects
- an object is anomalous if the nearest neighbours are far away
- i.e. the proximity of the object deviates significantly from the proximity of most other objects in the same dataset
- approach: outlier score: distance to $k$-th nearest neighbour
- score is sensitive to choice of $k$
- can produce some counterintuitive results:
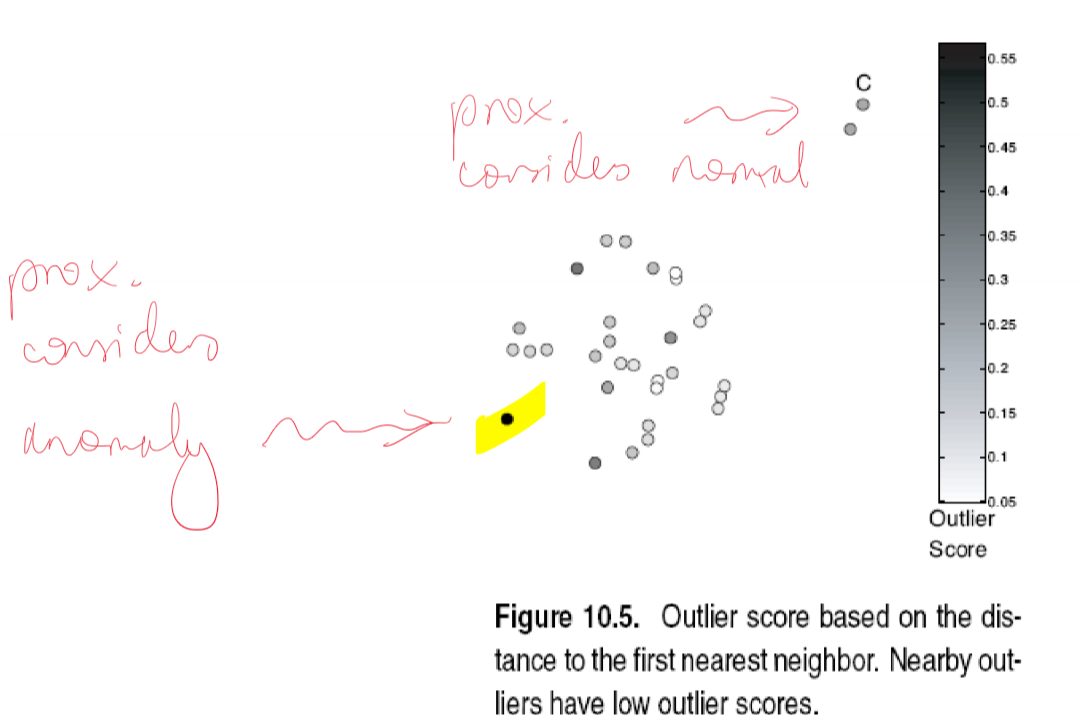
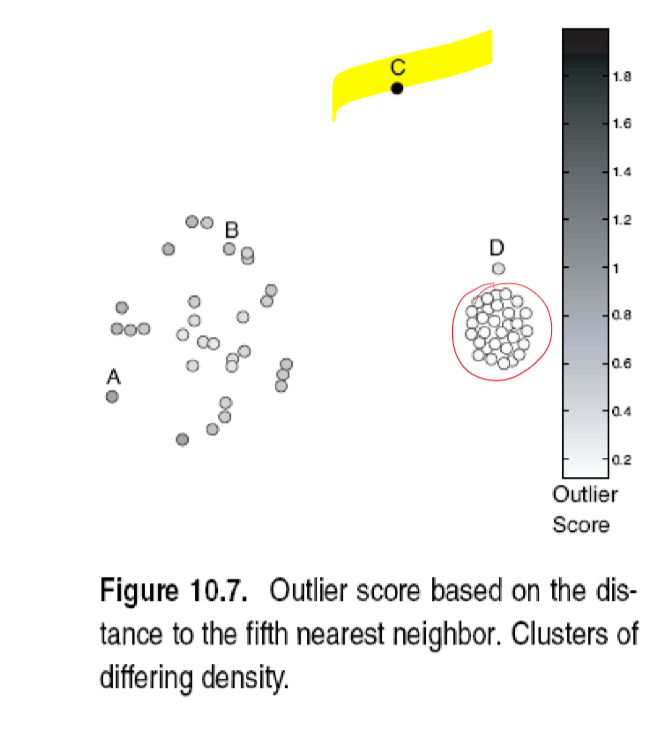
- in above image, 5-NN is used. Point D is close to a cluster, and so has a low anomaly score. However the cluster is very dense - so probably should be considered an outlier
Pros
- easier to define proximity measure than to determine statistical distribution of dataset
- quantitative measure of degree to which object is an outlier
- deals with multiple modes (i.e. multiple clusters)
Cons
- $O(n^2)$ complexity
- score is sensitive to choice of $k$
- doesn’t work well if data has widely variable density
Density-based Anomaly Detection
- idea: outliers are objects in regions of low density
- outlier score: inverse of density around a point
- scores are based on proximity
- example scores:
- number of points in a fixed radius $d$
- inverse of average distance to k-nearest neighbours
- $N(x, k)$: $k$ nearest neighbours of point $x$
- works poorly if data has variable density
Relative Density Outlier Score
- define Local outlier factor (LOF): reciprocal of average distance to $k$ nearest neighbours, relative to that of the $k$ neighbours
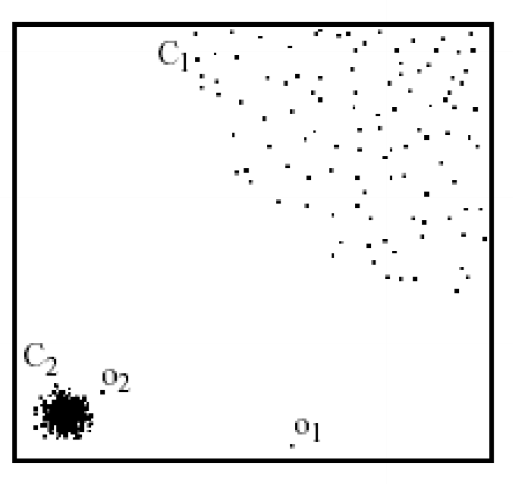
- in above image:
- proximity-based NN approach:
- $o_2$ not considered outlier as absolute distance to cluster is low
- LOF approach:
- $o_1, o_2$ considered outliers
- proximity-based NN approach:
Pros
- quantitative measure of degree to which object is an outlier
- works well even if data has variable density
Cons
- $O(n^2)$ complexity
- need to choose parameters appropriately
- $k$ for nearest neighbours
- $d$ for distance threshold
Cluster-based Outlier Detection
- outliers: objects that don’t belong strongly to any cluster
- generalisation of proximity/density based methods
- approaches
- assess degree to which object belongs to any cluster
- eliminate objects to improve objective function
- discard small clusters which are far from other clusters
- issue
- outliers may affect initial formation of clusters
- e.g. k-means is very sensitive to seeds
- outliers may affect initial formation of clusters
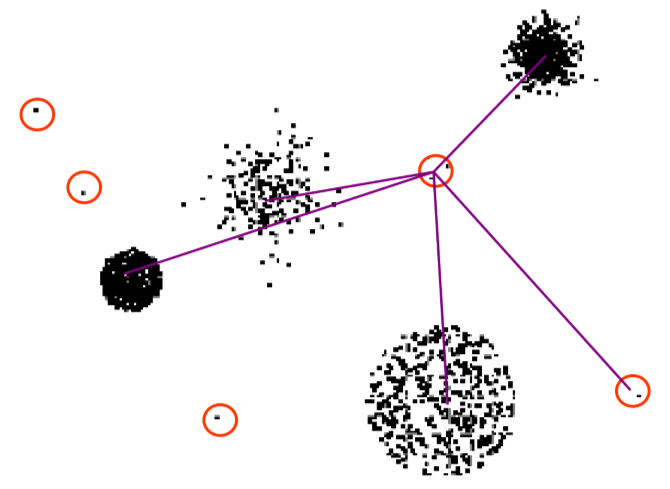
Degree to which object belongs to any cluster
- for k-means, use distance to cluster centres
- for variable density clusters, use relative distance
-
similar concepts for density-based and connectivity-based clusters
- if you used distance, instead of relative distance, points in low density clusters may get counterintuitively high outlier scores
- use of relative distance fixes this (similar to relative density approach)
Eliminate objects to improve objective function
- steps
- form initial set of clusters
- remove object which most improves objective function
- repeat until …
Discard small clusters far from other clusters
- need to define thresholds for small and far
Pros
- some clustering techniques are $O(n)$ complexity
- extends outlier concept from single objects to groups of objects
Cons
- requires thresholds for minimum size, distance to be set
- sensitive to number of clusters chosen
- hard to associate an outlier score with objects
- outliers may effect the initial formation of clusters